READING ROOM / PRACTICAL IDEAS
Read an arts report without turning attendance into people
Keep the geography, sample, year and unit attached to every cultural statistic.
In this guide 6 sections
Start with the boundary of the study
Pew’s Philadelphia 2009 report analyses 224 nonprofit cultural groups within the city, using the latest available data: 2006 for 75 groups and 2007 for 149. Its printed page 40 reports 2007 attendance of 6,279,187 paid, 5,113,180 unpaid and 1,632,917 schoolchildren, totalling 13,025,284. These are period-specific attendance figures for that research context. They are not Old City’s current audience, website users or a count of unique residents.
Read the footnote before comparing reports
The complete 76-page 2008 Portfolio is available through Pew. It covers 281 Southeastern Pennsylvania organisations, mostly using FY2006 or FY2007 data; its 1995–2005 trend study uses a separate 108-organisation sample. Printed page 68 lists Old City Arts Association without the trend-study marker. The report’s printed page 9 explains that repeated participation prevents aggregate attendance, membership or volunteer positions from being counted as unique people. Its 17-page key-findings version is a summary, not another study. Keep the full report beside any extract so that the methods and qualifications stay available.
Two reports. Two boundaries.
- 012008 Portfolio
Southeastern Pennsylvania · 281 organisations · mostly FY2006/FY2007. Its separate trend study follows 108 organisations in 1995–2005.
- 02Philadelphia 2009
City of Philadelphia · 224 cultural groups · 75 with 2006 data and 149 with 2007 data. Its cited attendance chart refers to 2007.
- ?A regional total is not one organisation’s audience
Check the area, sample, year and unit before combining figures. No growth rate is calculated from these unlike boundaries.
Keep a six-field statistics card
Before reusing a number, write its source, reference period, geography, sample or scope, unit and limitation. “Attendance” may count repeat visits; “respondents” counts answers within a survey; “organisations” counts participating entities. Those units cannot be substituted for one another. If a denominator is missing, do not invent a percentage. If a report combines different source years, retain that detail beside the claim rather than hiding it in a distant note.
A worked example of attendance and unique visitors
Imagine a workshop series with eight participants. Four attend once and four attend twice: the series records 12 attendances but eight distinct participants. The arithmetic is 4 × 1 + 4 × 2 = 12. The illustrated example below keeps the same colour for a returning participant: a second visit creates another entry, not another person. This is an invented counting exercise, not an estimate for an Old City programme. Staffing a session uses attendance; describing people reached requires a valid distinct-person measure. Adding membership, attendance and volunteer-position totals would mix overlapping categories rather than produce a reliable total audience.
8 people. 12 visits.
An illustrative counting example, not programme data.
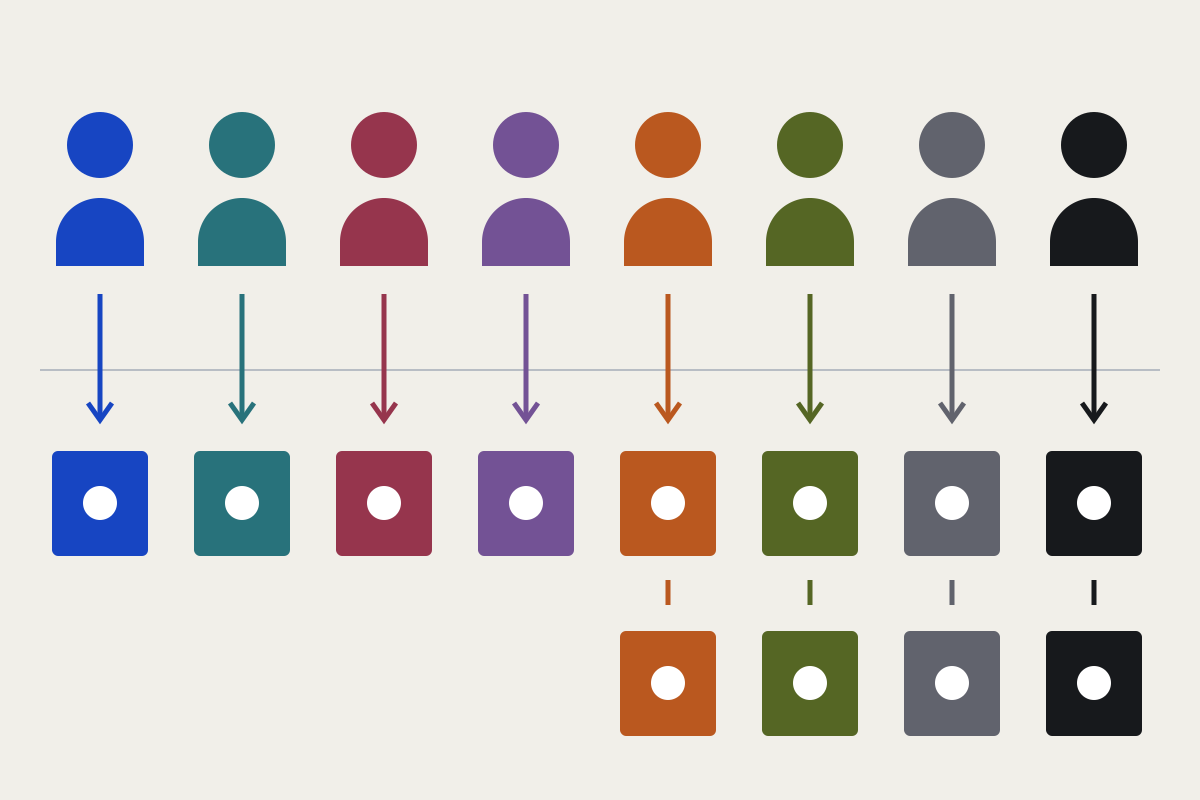
Four attend once: 4 × 1 = 4 visits.
Four attend twice: 4 × 2 = 8 visits.
Total: 8 distinct people, 12 visits.
Check a chart’s meaning as well as its arithmetic
The chart below uses the three reported categories and the same zero baseline. Their sum can be checked directly. It does not rank individual institutions, combine different years or imply that each attendance is a new visitor. When reading another graphic, inspect the baseline, category labels and whether the area or length represents the stated value. A large visual difference may be a design choice rather than a large measured difference.
Use the report to ask a better question
Here is a filled source card for the recovered report: source — Greater Philadelphia Cultural Alliance, 2008 Portfolio; period — mostly FY2006/FY2007; place — Southeastern Pennsylvania; sample — 281 organisations; separate trend sample — 108 organisations in 1995–2005; unit — aggregated activity, with repeat participation possible. For any proposed comparison, write a second card and circle the fields that differ. A mismatch means the arithmetic needs an explanation before you call it growth or decline. For a current project, find a newer primary source with a suitable scope. A regional report cannot establish the present audience or results of one Old City organisation. Leave unconfirmed fields unresolved rather than estimating them.
2007 attendance
Philadelphia cultural events · figures reported by Pew in 2009
Total attendances13,025,284
Take this method with you
- 01Scope
City, region and participating organisations are different boundaries.
- 02Unit
Attendance, people and survey responses answer different questions.
- 03Period
The document date and the data year need not match.
Sources & further reading
- www.pewtrusts.org/-/media/assets/2009/03/30/pri_09reportsngl.pdf
- www.pew.org/-/media/legacy/uploadedfiles/wwwpewtrustsorg/reports/supporting_arts_and_culture/2008portfoliofullreportpdf.pdf
- www.pewtrusts.org/-/media/legacy/uploadedfiles/wwwpewtrustsorg/reports/supporting_arts_and_culture/2008portfoliokeyfindingspdf.pdf
- philaculture.org/what-we-do/research/reports/2008-portfolio